
Understand Cognite Data Fusion
By the end of this level you will be able to explain to a colleague what Cognite Data Fusion is, why plants need it, how data flows through it, what its layers are, and whether it is a skill worth investing in. No coding is needed at this level.
- You work with (or around) industrial plants — sensors, historians, maintenance systems, drawings.
- You have a CDF login (you do) — or you can use the free public sandbox described in Module 5.
- That's it. Everything else is explained here.
Why Cognite? The industrial data problem
⏱ 45 min- The three families of plant data (OT, IT, ET) and why they never talk to each other
- What "contextualization" means, in plain words
- Who Cognite is and where they came from
1.1 Three islands of data in every plant
Walk into any power plant, refinery or factory and you will find that the data about a single piece of equipment — say Boiler Feed Pump BFP-1A — is scattered across at least three separate worlds:
| Family | What it is | Where it lives | Who uses it |
|---|---|---|---|
| OT — Operational Technology | Live sensor readings: pressures, temperatures, flows, vibration, alarms, set-points | DCS / SCADA / PLC, historians (OSIsoft PI, AVEVA, Honeywell PHD), OPC servers | Operators, control-room, instrumentation engineers |
| IT — Information Technology | Business records: work orders, maintenance history, spare parts, costs, planning | SAP PM, IBM Maximo, ERP, CMMS, spreadsheets, databases | Maintenance planners, finance, management |
| ET — Engineering Technology | How the plant was designed: P&IDs, datasheets, 3D CAD models, isometrics, manuals | Document management systems, SharePoint, engineering tools, file shares | Design engineers, reliability engineers, inspectors |
Each world has its own software, its own naming (the pump is BFP-1A in the P&ID, 21-PA-001A in SAP, and U2.BFP1A.DISCH.PRESS in the historian), and its own owner. Nobody can look at one screen and see the whole truth about BFP-1A.
Imagine a hospital where the lab keeps blood results in one cabinet, the pharmacy keeps prescriptions in another, and radiology keeps X-rays in a third — each with a different patient ID. A doctor who wants to understand one patient has to visit three rooms and match records by hand. That is the daily life of a plant engineer. Cognite Data Fusion is the single patient record: one file per patient (per pump, per boiler) with everything attached.
1.2 What "contextualization" means
You will hear this word constantly in the Cognite world. It sounds complicated; it is not.
Contextualization = discovering and storing the relationships between pieces of data that belong to the same real-world thing. The time series U2.BFP1A.DISCH.PRESS belongs to the pump BFP-1A; the P&ID drawing 21-PID-004 shows that pump; work order 4711 was done on that pump. Contextualization is the act of drawing those lines — and CDF does most of it automatically with AI (matching tag names, reading drawings, mapping 3D models).
Once the lines are drawn, you can ask questions a plain historian can never answer: "Show me every pump whose vibration went up in the 30 days after a bearing replacement." That needs OT (vibration), IT (work orders) and ET (which pumps have that bearing) joined together.
1.3 Who is Cognite?
- Founded in Oslo, Norway by a team from the industrial group Aker ASA (incorporated October 2016; Cognite's own materials date the company to 2017, when it began operating). Co-founder John Markus Lervik was CEO until 2022; Girish Rishi has been CEO since. The oil company Aker BP was the anchor customer — and Cognite's largest customer and a shareholder until 2022 — and still runs its offshore operations on CDF.
- Scale (2025): revenue above $170 million, ARR bookings up 36%, 800+ employees; earlier investors include TCV (a $150 million round in 2021 valuing Cognite at $1.6 billion) and Saudi Aramco.
- June 30, 2026 — Schneider Electric agreed to acquire Cognite for $3.1 billion in cash. Cognite is to be integrated with AVEVA (Schneider's industrial-software arm), with Data Fusion and Atlas AI becoming the data-and-AI layer inside AVEVA's CONNECT platform. Closing is expected "in the coming quarters", subject to regulatory approvals. Module 6.4 discusses what this means for the skill.
- Product: Cognite Data Fusion® (CDF) — a software-as-a-service (SaaS) platform. Nothing to install on premises except small "extractor" programs that push data up.
- Newer layer: Cognite Atlas AI™ — a workbench for building AI agents that answer questions using the knowledge graph.
- Industries: oil & gas (Aker BP, BP, Saudi Aramco; SLB as a partner), power generation & grid (e.g. Statnett), chemicals (Celanese), manufacturing (Alfa Laval, Mitsubishi Heavy Industries), renewables. Sold directly and through cloud and consulting partners (Microsoft, AWS, Google Cloud, SLB, Accenture and others).
- The category they created is called Industrial DataOps — applying the discipline of DevOps to industrial data: automated, monitored, governed pipelines instead of one-off spreadsheets.
Think of one piece of equipment you know well. Write down: (1) three sensor tags for it, (2) where its maintenance history lives, (3) the drawing number that shows it. Notice how the three names differ. You just did manual contextualization — keep this example; we will use it in Module 3.
What is Cognite Data Fusion? The 8 layers
⏱ 75 min- A one-sentence definition of CDF you can repeat
- The official architecture diagram, layer by layer
- The vocabulary used across the platform
2.1 The definition
"Cognite Data Fusion is an industrial DataOps platform that streams your industrial data into a structured, flexible, and contextualized knowledge graph."
In your own words: CDF is a cloud service that pulls data from all your plant systems, links the pieces that belong together, stores them as a graph, and lets people, apps, and AI agents use that graph.
2.2 The official architecture diagram
This is Cognite's own architecture picture from the documentation. Read it left to right: data enters on the left, gets integrated, becomes the knowledge graph in the middle, and is consumed on the right. The bottom band is the foundation it all sits on.

2.3 The 8 layers, one by one
Here is the same diagram flattened into a stack so you can read each layer. The chips are the exact capability names Cognite uses.
Layer 1 — Data sources (what goes in)
Everything from Module 1: historians and control systems (OT), business systems (IT), drawings and models (ET), plus two newer sources — field workers (checklists, photos, observations captured on tablets) and robots/drones (inspection images, thermal scans).
Layer 2 — Data integration (how it gets in and gets linked)
- Extractors — small programs (Cognite-provided or your own) that read from a source system and push data to CDF. The Extractors page lists 102 entries — 23 Cognite-built extractors plus 79 documented source integrations (Cognite's marketing says "90+ connectors"): OPC UA, OSIsoft/AVEVA PI, SAP, databases, MQTT, Kafka, Azure Event Hub, file shares…
- Connectors — two-way links to cloud platforms (e.g. Microsoft Fabric) so data can flow both directions.
- Transformations — SQL-based (or Python) steps that reshape raw rows into the data model: rename columns, join tables, compute fields.
- Data workflows — the orchestrator: "run extractor → then transformation → then function, every hour; alert me on failure."
- Functions — your own Python code, hosted and scheduled inside CDF (like AWS Lambda, but with the CDF SDK built in).
- Entity matching, Diagram parsing, 3D contextualization — the AI tools that draw the relationship lines (Module 1.2). Entity matching links tag names to assets; diagram parsing reads P&IDs and finds every tag on the drawing; 3D contextualization maps CAD nodes to assets.
Layer 3 — Industrial knowledge graph (where it lives)
The heart of CDF. Not just a database — a graph: things (nodes) and relationships (edges), each with properties. It natively stores time series (billions of data points), files (PDF, images), 3D models and point clouds, geospatial shapes, annotations (e.g. "this box on page 3 is tag 21-PT-1019"), and units of measurement. Data modeling is how you define the shape of your graph (Module 4).
Layer 4 — Data management (how you govern it)
Explore and search everything, catalogue it (which data set, from which source, with what quality), and control who can see and change what via access management tied to your company's identity provider.
Layer 5 — Atlas AI (the agents)
Low-code agent builder to create AI assistants that answer questions using the knowledge graph ("why did the compressor trip last night?"), a library of ready-made agents (root-cause analysis, troubleshooting), and LLM benchmarking to pick the best language model for each job.
Layer 6 — Industrial tools (the apps people use)
- Search — Google-like search across assets, time series, documents, 3D.
- Canvas — a free-form whiteboard where you drop P&IDs, charts, 3D, photos and work orders side by side, comment, and ask the AI copilot questions (see Module 5).
- Charts — trend and calculate on time series without code; set alerts.
- InField (field operations) — tablet app for operator rounds, checklists, observations.
- Maintain (maintenance planning) — build and optimise turnaround/maintenance scopes.
- InRobot (robotics) — plan and run robot inspection missions.
Layer 7 — Consume & integrate (how developers and BI reach it)
Everything in CDF is available through a REST API, a GraphQL endpoint for the data model, official Python and JavaScript SDKs, and ready connectors for Power BI (OData) and Grafana. If you can call an API, you can build on CDF.
Layer 8 — Foundation
CDF runs as SaaS on AWS, Azure, or Google Cloud (you pick the region/cloud), authenticates with OpenID Connect against your own identity provider (Microsoft Entra ID etc.), and is certified to ISO 27001. More in Module 7.
Data sources are the publishers. Extractors are the delivery vans. Transformations are the cataloguers who put a proper label and shelf-number on each book. The knowledge graph is the library itself — but a magical one where every book is linked to every other book that mentions the same subject. Data management is the librarian's desk (membership cards, who may enter the rare-books room). Industrial tools are the reading rooms designed for different visitors. The API is the inter-library loan service. And Atlas AI is a research assistant who has read every book and answers your question with citations.
2.4 Vocabulary you will meet everywhere
hnm-dev. Companies usually have dev / test / prod projects.A fuller glossary is at the bottom of this page.
Watch the official architecture walkthrough below, then, without looking, list the 8 layers from memory. If you get 6 or more, move on.
How data flows — end to end
⏱ 75 min- The six stations every piece of data passes through
- What each station produces
- A concrete worked example from a power plant
3.1 The six stations
| CDF station | Kitchen equivalent | Why it matters |
|---|---|---|
| 1 Source | Farms and suppliers | Each grows one thing well; none of them cook. |
| 2 Extract | Delivery trucks | Regular, scheduled, reliable; they don't change the goods. |
| 3 RAW | Cold store / pantry | Everything stored exactly as delivered, with the delivery note. You can always go back to it. |
| 4 Transform | Prep station | Wash, peel, chop, label — turn raw ingredients into standard, ready-to-use parts. |
| 5 Contextualize | The recipe | Defines which parts go together. A pile of ingredients is not a dish; the relationships make the dish. |
| 6 Consume | Dining room, takeaway, delivery app | Different customers want the same food served differently — a plate, a box, an app. |
3.2 What each station produces
| Station | CDF feature used | Output | Who owns it |
|---|---|---|---|
| Extract | Extractors (hosted in CDF or self-hosted on your server), Extraction pipelines for monitoring | Rows in RAW tables, or datapoints in time series, or files | Integration engineer |
| Stage | RAW (staging database) | RAW tables — schemaless, one row per source record | Integration engineer |
| Transform | Transformations (Spark SQL), scheduled | Instances in the data model (nodes and edges) | Data engineer |
| Contextualize | Entity matching, Diagram parsing (interactive P&IDs), 3D contextualization | Relationships + annotations, with confidence scores; approved by a domain expert | Data engineer + domain expert |
| Orchestrate all of the above | Data workflows, Functions | Scheduled, monitored, alerting pipelines | Data engineer |
| Consume | Search, Canvas, Charts, InField, Power BI, Grafana, SDKs, Atlas AI | Dashboards, analyses, apps, agent answers | Everyone |
3.3 Worked example — a boiler feed pump in a coal-fired unit
Let us follow one tag and one pump through the whole journey, using names you would recognise from a thermal power plant.
U2.BFP1A.DISCH.PRESS updates every secondU2.BFP1A.DISCH.PRESSsap.work_orders; P&ID PDFs uploaded as filesBFP-1A under Unit 2 › Feedwater; creates Activity for WO 4711Notice what happened at the Link step: three different names (U2.BFP1A.DISCH.PRESS, BFP-1A, and the SAP functional location 21-PA-001A) were resolved to the same node. From then on, anyone who opens BFP-1A sees the trend, the drawing, and the work-order history together — no more hunting.
If you already know PI / AVEVA / OPC UA, you already understand station 1 and 2 — the PI extractor and OPC UA extractor are the most common way to bring OT data into CDF. Your historian knowledge becomes the entry ticket; CDF adds the IT and ET halves.
3.4 Batch vs. streaming
- Streaming (seconds): time-series datapoints from OPC UA / PI / MQTT go straight to the time-series store.
- Scheduled batch (minutes to daily): SAP work orders, equipment master data, documents — extract → RAW → transform on a schedule.
- One-off: 3D models, historical drawing archives — uploaded once, revised occasionally.
Data workflows tie these together and give you a single screen showing whether every pipeline ran on time.
3.5 Watch the flow
Take the equipment you wrote down in Module 1 and fill in the six stations for it on paper: source system, extractor type, RAW table name, what the transformation would create, what needs linking, and which tool would you use to look at it. You now have a mini integration design.
The Industrial Knowledge Graph & the Core Data Model
⏱ 90 min- What a knowledge graph is and why a graph beats tables for plant data
- The types in Cognite's Core Data Model and how they relate
- The four building blocks of data modeling (spaces, containers, views, data models) — at a high level
4.1 What a knowledge graph is
A relational database stores tables. A knowledge graph stores things and their relationships. Each thing is a node with properties; each relationship is an edge. The power comes from being able to walk the edges: from a pump to its sensors, from a sensor to the drawing that shows it, from the drawing to the other equipment on the same page.
LinkedIn does not store you as a row in a "people" table. It stores you as a profile connected to your employer, your colleagues, your posts and your skills. That is why it can suggest "people you may know" — it walks the connections. The Industrial Knowledge Graph is LinkedIn for pumps: every asset has a profile connected to its sensors, documents, work orders, 3D position, and neighbours on the P&ID.
4.2 The Core Data Model (CDM)
You could design your own graph from scratch, but Cognite ships a standard, ready-made schema called the Core Data Model. Using it means every Cognite tool (Search, Canvas, Charts, InField, Atlas AI) understands your data out of the box. The main types (all prefixed Cognite):
| Type | Represents | Typical example | Key properties / relations |
|---|---|---|---|
CogniteAsset | A function in the plant, arranged as a tree | Unit 2 → Feedwater system → BFP-1A | name, description, parent, children, path, root; links to equipment, timeSeries, files, activities, object3D |
CogniteEquipment | The physical device installed in that function (can be swapped) | Pump serial 88213, motor M-1A | serialNumber, manufacturer, equipmentType; asset |
CogniteTimeSeries | A sensor tag / calculated signal | Discharge pressure, motor current | type (numeric/string), isStep, unit, sourceUnit; assets, equipment |
CogniteFile | A document | P&ID, datasheet, inspection photo | mimeType, directory, category; assets, equipment |
CogniteActivity | Something with a start and end time | Work order, shutdown, inspection round | startTime, endTime, scheduled times; assets, equipment, timeSeries |
Cognite3DObject | Where the asset is in 3D | The pump's bounding box in the plant CAD model | xMin…zMax; links to CAD nodes, point-cloud volumes, 360° images |
CogniteAnnotation | A discovered link with confidence | "Box at (0.42, 0.61) on page 1 of 21-PID-004 is tag 21-PT-1019" | confidence, status (Suggested / Approved / Rejected) |
CogniteUnit | A unit of measurement | bar, °C, A, m³/h | symbol, quantity; enables automatic unit conversion in Charts |
The Asset is the role ("the first-stage boiler feed pump position"); the Equipment is the object currently doing that role (pump serial 88213). When you replace the pump, the asset stays and a new equipment node is linked. This is exactly the SAP "functional location vs. equipment" idea — CDF makes it explicit.
4.3 The four building blocks of a data model (overview only)
You will go hands-on with these in Level 2. For now, just know the names and the picture:
hnm_power. Separates teams and scopes access.Pump.PowerPlantModel v1 — exposed via GraphQL.Then you ingest instances (nodes and edges) into the model with transformations or the SDK, and query them with GraphQL, the REST API, or the Python SDK. Cognite also offers industry-specific extensions of the Core Data Model, e.g. the Process Industries Data Model.
A container is the filing cabinet drawer with labelled slots (fields). A view is the printed form that shows a chosen subset of those slots in a friendly layout. A data model is the binder of all the forms for one department. A space is the department's locked office. An instance is one filled-in form.
Draw the Figure 4.1 graph for your equipment from Module 1: the asset, its parent, one equipment node, three time series, two files and one activity. Label each with the Core Data Model type. This is the exact exercise in the Cognite Academy "Core Data Model Fundamentals" microlearning (8 min) — take it now.
Touring the CDF user interface & where to practise
⏱ 90 min · hands-on- How the CDF web application ("Fusion") is organised
- What the Industrial Tools look like and what each is for
- How to explore data in your own login and in the free public sandbox
5.1 The layout
Log in at your company's CDF URL (it looks like https://<org>.fusion.cognite.com). You land on a Home page with a left navigation rail. Exact labels move around between releases, but they always group into these areas — and they map straight onto the layers from Module 2:
| Navigation area | What you do there | Layer |
|---|---|---|
| Home / Search | Global search across assets, time series, files, events, 3D; recently viewed; favourites | 4 · Data management |
| Industrial tools | Canvas, Charts, InField, Maintain, InRobot, 3D viewer, Copilot / Atlas AI agents | 5 & 6 |
| Data management / Explore | Browse data sets, data catalog, data quality, RAW tables, data models | 3 & 4 |
| Integrate | Extractors library, extraction pipelines, hosted extractors, transformations, data workflows | 2 · Data integration |
| Build solutions | Data models (GraphQL editor), Functions, Jupyter notebooks, Streamlit apps | 2, 3 & 7 |
| Admin | Access management (groups, capabilities), identity provider, project settings | 4 & 8 |
5.2 Integrate — the Extractors library
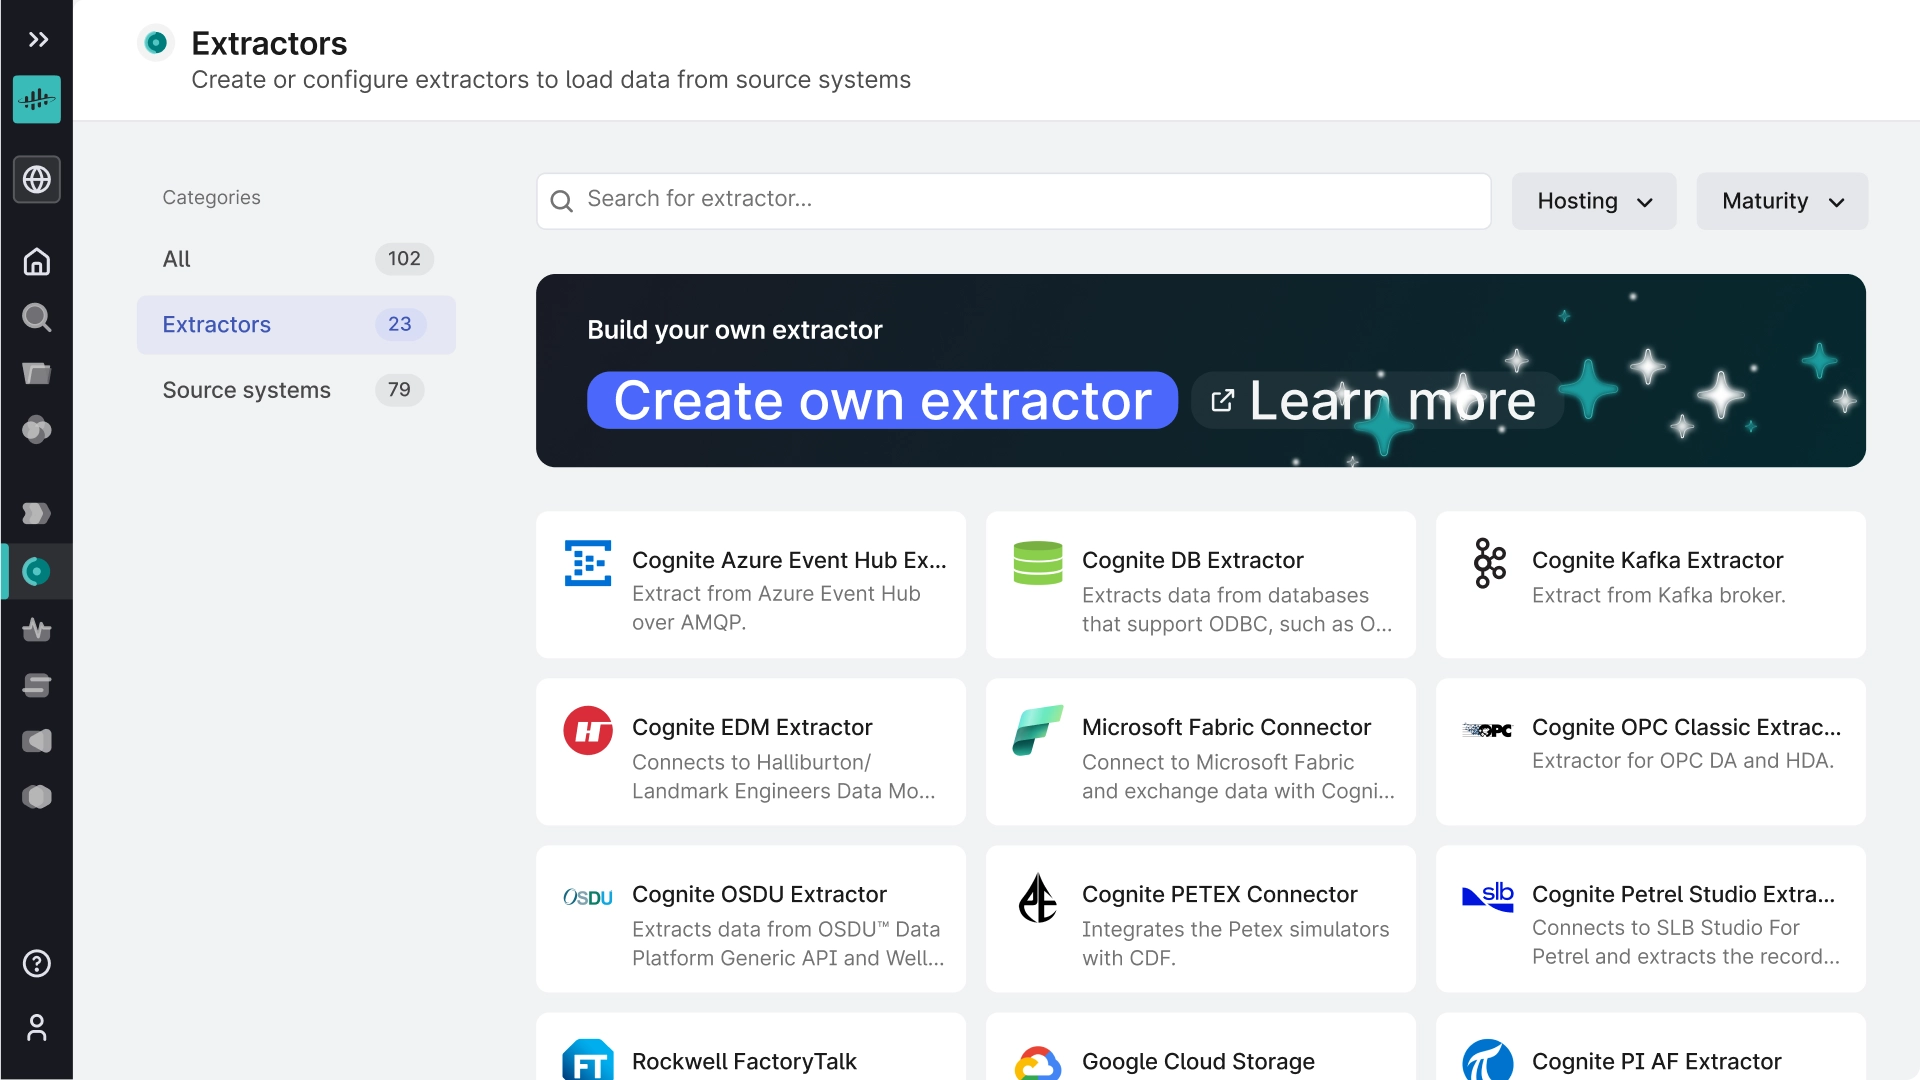
cognite-extractor-utils Python library.Names you will recognise: Cognite PI AF Extractor (AVEVA/OSIsoft PI), OPC Classic and OPC UA, DB Extractor (any ODBC database), Kafka, Azure Event Hub, Microsoft Fabric Connector, Rockwell FactoryTalk, plus oil & gas specific ones (OSDU, Petrel, EDM).
5.3 Industrial Canvas — the collaborative whiteboard
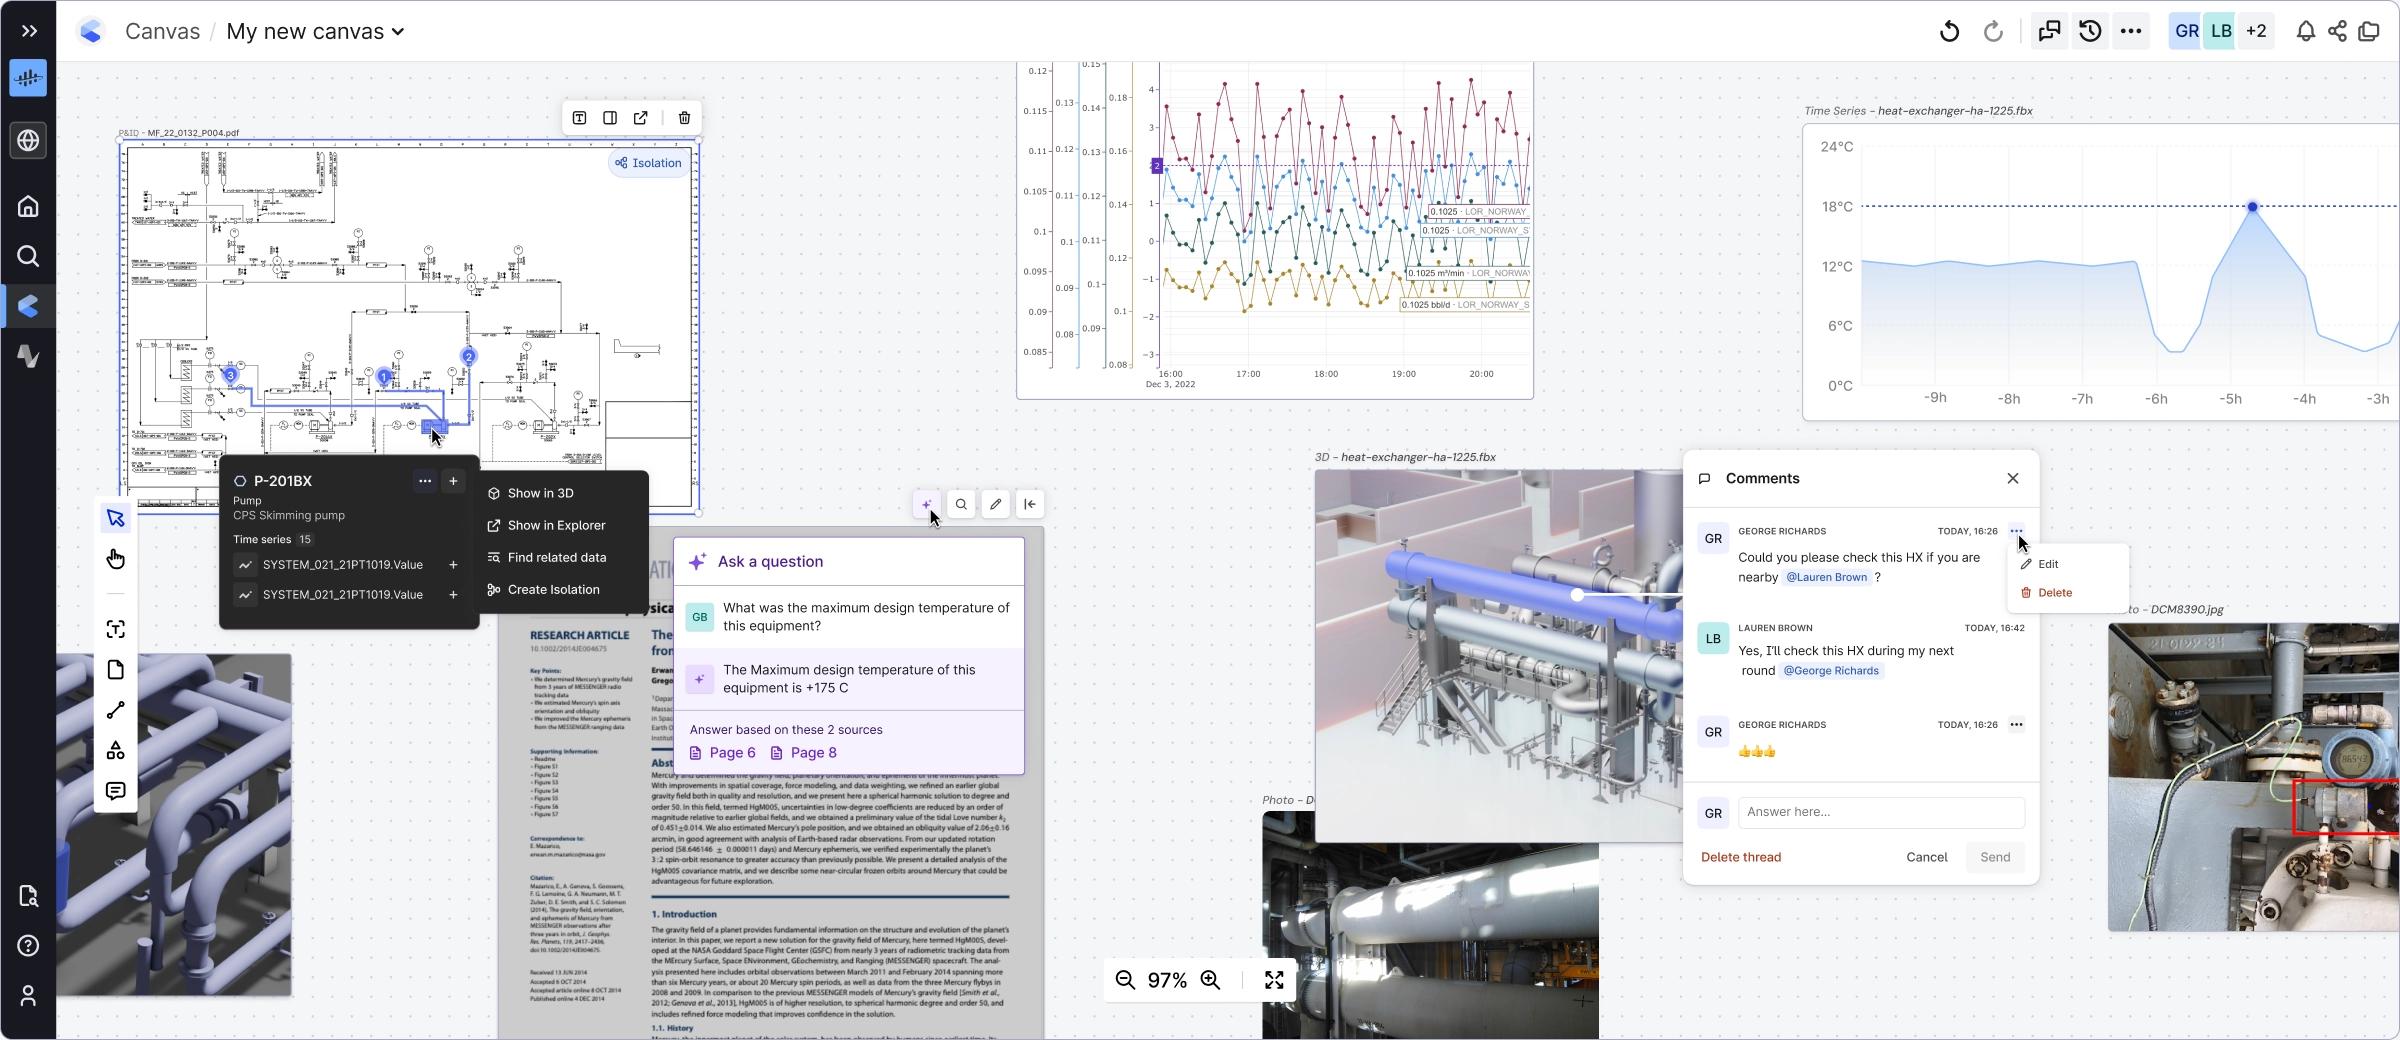
P-201BX selected and its 15 time series listed), trend charts, a 3D model, a datasheet, a site photo, a comment thread between colleagues, and an AI question ("What was the maximum design temperature of this equipment?") answered from the document with page citations.Canvas is where the knowledge graph becomes visible. Because everything is linked, clicking the pump on the P&ID offers Show in 3D, Find related data, Create isolation. This is the tool most domain experts start with — it needs no training beyond "drag things onto the board".
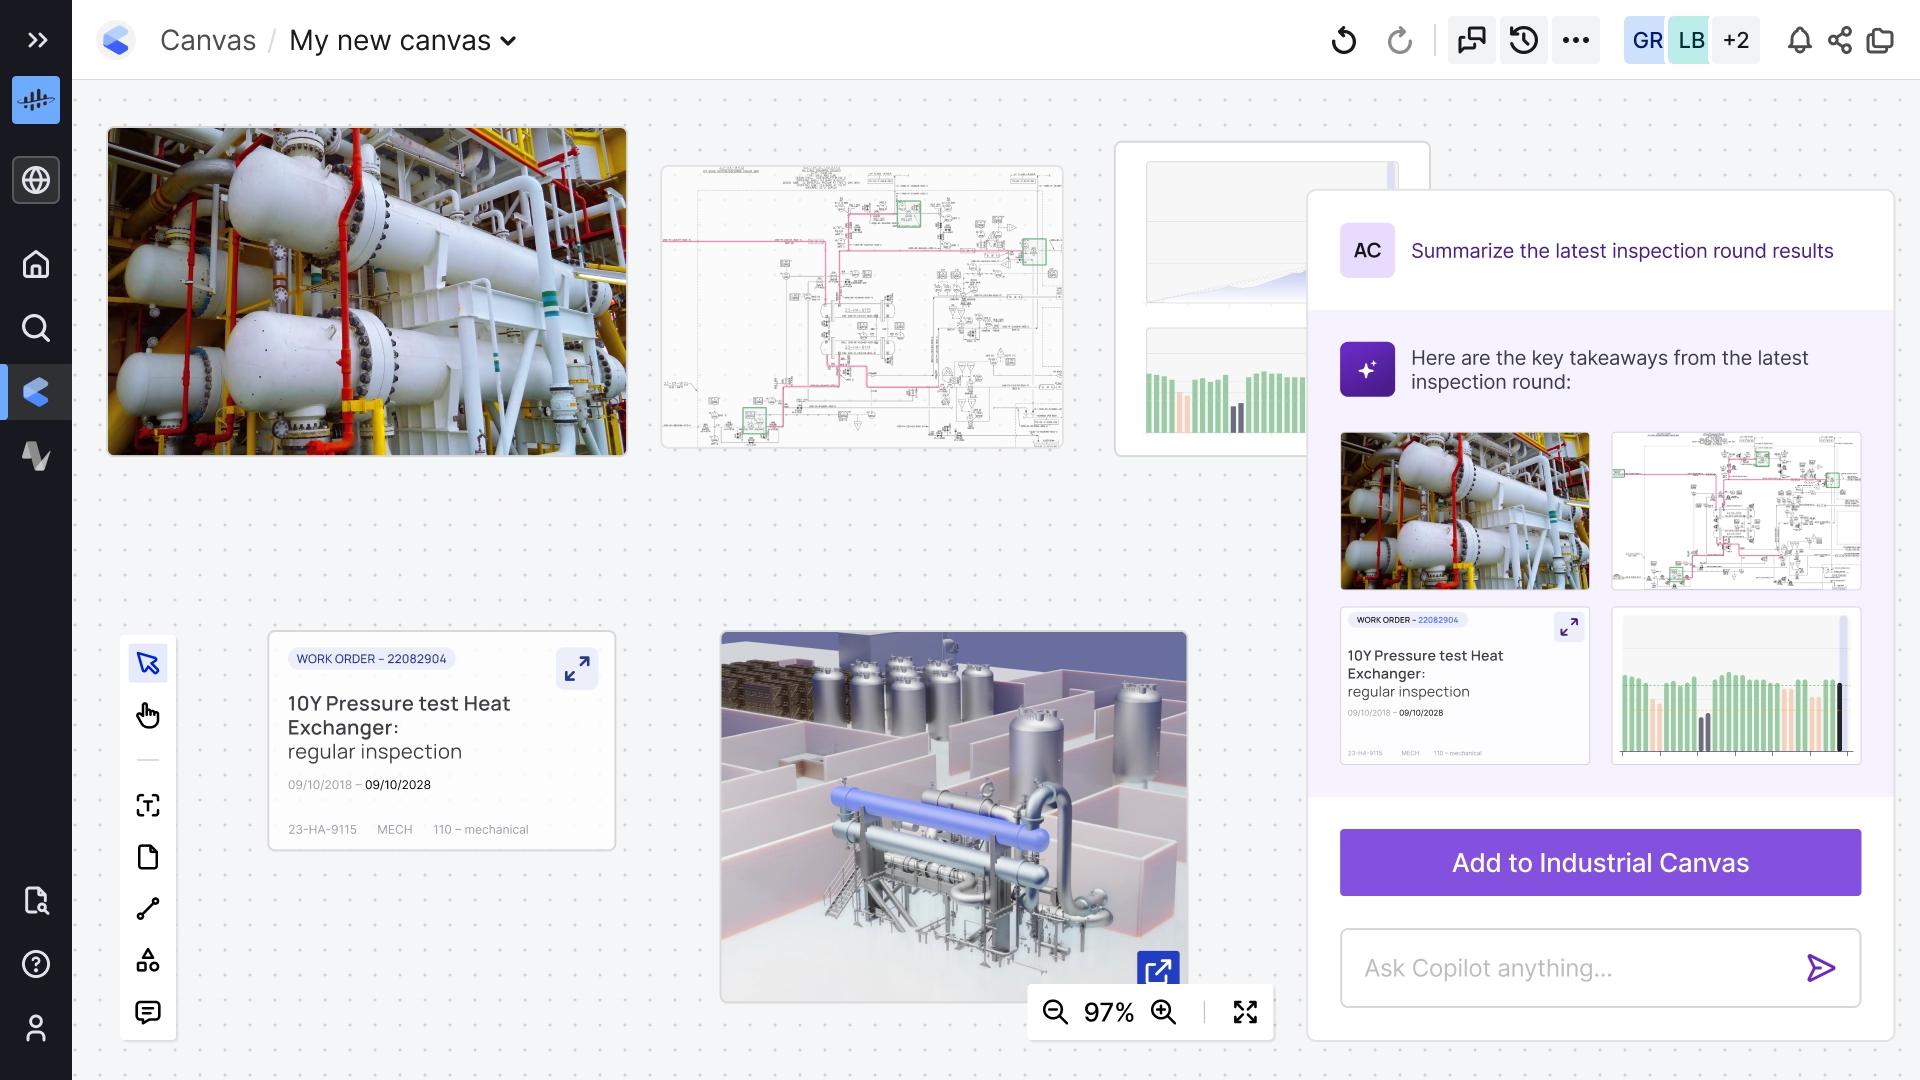
5.4 The other Industrial Tools in one line each
5.5 Where you can practise — four options
CDF cannot be installed on your laptop. It is a cloud service only (300+ micro-services on Kubernetes — Module 7), and Cognite no longer offers a self-service trial project (the old developer.cognite.com/signup now just redirects to the docs). What can run locally is the tooling: the Python SDK, Jupyter, the Toolkit CLI. So you practise against a cloud project — and there are four free ways to do that.
| Option | What you get | Cost / effort | Use it for |
|---|---|---|---|
| A · Your company CDF login | Real plant data, the real UI, the tools your colleagues use. Ask your admin for read access to all data sets and, ideally, a dev project for write exercises. | Free (you have it) | Modules 5–7 now; Level 2 hands-on later |
B · Open Industrial Data sandbox (publicdata / publicdatacdm) | A live CDF project with real data from Aker BP's Valhall platform: the first-stage gas compressor 23-KA-9101 with its coolers, scrubber, valves, lubrication and seal systems — time series, maintenance work orders, P&IDs. Full Fusion UI, Search, Canvas, Charts, plus API/SDK access. | Free · 10-minute signup | Everything in Level 1–2 when you want to click without fear of breaking anything |
| C · Interactive click-through demos | Guided, scripted tours of the product inside your browser — no login, nothing to install. | Free · 5 min each | A first look at Canvas / Search before you have access |
| D · Local machine: Python SDK + Jupyter | Install the SDK on your laptop and talk to option A or B from code. This is the Level 2 way of working, but you can do "hello world" today. | Free · 15 min | Level 2 Topic 5 onwards; a taste now |
Option B in detail — get into the free sandbox
- Create a free account on Cognite Hub: hub.cognite.com (email or Google login). This one account gives you the Hub community, Cognite Academy, and the sandbox.
- Open the Open Industrial Data group and read the pinned "What is Open Industrial Data?" post (5 min) — it describes the Valhall first-stage compressor system you will be looking at.
- Go to publicdata.fusion.cognite.com and sign in with the same account. You will land in the CDF UI of the
publicdataproject. - Two projects share the data:
publicdata(classic asset hierarchy) andpublicdatacdm(the same data loaded into the Core Data Model from Module 4 — use this one to see CogniteAsset / CogniteEquipment / CogniteTimeSeries for real). - The connection details for code (Option D) are on the group's "OpenID Connect on Open Industrial Data" post — copied below. Licence: free for learning and non-commercial use within your organisation; commercial use and redistribution are not permitted, and academic publication was still an open question on the Hub as of late 2025 (terms thread).
Option C — the click-through demos (no login)
Option D — hello world from your laptop (15 min)
Python 3.10+ is enough. In a terminal:
pip install cognite-sdk msal pandasThen in a Python file or Jupyter notebook — this opens a browser window for you to sign in with your Cognite Hub account, and lists the first assets and time series of the sandbox:
from cognite.client import CogniteClient

client = CogniteClient.default_oauth_interactive(
    project="publicdata",                                   # or "publicdatacdm"
    cdf_cluster="api",                                      # -> https://api.cognitedata.com
    tenant_id="48d5043c-cf70-4c49-881c-c638f5796997",       # Cognite Hub tenant (from the OIDC post)
    client_id="1b90ede3-271e-401b-81a0-a4d52bea3273",       # public client for Python / Postman
    client_name="hnm-learning",
)

print(client.assets.list(limit=5).to_pandas())
print(client.time_series.list(limit=5).to_pandas())
For your own company project, replace project, cdf_cluster, tenant_id and client_id with the values your CDF admin gives you (they are shown under Admin → Access management → Identity provider). You will meet this code again, properly, in Level 2 Topic 5.
- Open Search. Type part of any equipment name. Note the result types (asset, time series, file, event).
- Open an asset. Find its hierarchy (parent / children), its time series tab, and its files tab. That is Figure 4.1 in real life.
- Open one time series and click Open in Charts. Change the time range to 7 days.
- Go to Integrate → Extractors and find the PI, OPC UA and DB extractors. Read the description of each.
- Go to Data management → Data sets. How many data sets exist and what are they named after (source system? plant unit?).
- In
publicdata, search for23-KA-9101— that is the Valhall first-stage compressor. Open it and count its time series and files. - Open one of its P&IDs. Hover the tag boxes: they are annotations created by diagram parsing (Module 2, layer 2). Click one to jump to the asset.
- Open a vibration or temperature time series in Charts; overlay a second one; add a simple calculation (e.g. difference).
- Create a Canvas, drop the P&ID, the chart and one work order onto it, and write a one-line comment. Congratulations — you have used the knowledge graph.
- Switch to
publicdatacdmand find the same compressor as aCogniteAsset. Compare the tabs with Figure 4.2.
Workshop notebooks for later: github.com/cognitedata/open-industrial-data. Academy click-through: Navigating Cognite Data Fusion (5 min).
5.6 Watch the tools in action
Benefits, ROI & "should I learn this?"
⏱ 45 min- Where the money comes from when a plant adopts CDF
- What real customers achieved
- How CDF compares with a historian or a data lake
- An honest view on the career value of this skill
6.1 The business case in numbers
Forrester Consulting has produced Total Economic Impact studies commissioned by Cognite. The 2022 study reported 400% ROI and $21.6M net present value for a composite organisation (30 facilities, 25,000 employees, $2B revenue). Cognite's current product and customer pages cite an updated study with the figures below — all are modelled composite results over three years, not one customer's audited numbers:
Where do these come from? Four mechanisms:
- Time to find data → time to fix problems. Engineers typically spend the majority of their analysis time locating and cleaning data. When the pump's trend, drawing and history are one click apart, a root-cause analysis that took days takes hours.
- Condition-based instead of calendar-based maintenance. Linking sensors to work orders lets you see which equipment actually degrades — and stop over-maintaining the rest.
- Production optimisation. Cross-system calculations (heat rate, specific energy, efficiency curves) become live time series instead of monthly spreadsheets.
- Reuse. A data foundation built once serves hundreds of use cases; the cost of the 50th dashboard is near zero.
6.2 What real customers report
Aker BP (oil & gas, Norway)
Anchor customer since Cognite's founding. Siemens built real-time condition monitoring for Aker BP's Ivar Aasen field on CDF: integration done in 200 hours instead of an estimated 1,500 — 1,300 hours saved, ~$6.5M estimated savings, 400,000+ documents contextualised. Atlas AI root-cause-analysis agents cut engineers' RCA time by over 70% (Sept 2025). Field: up to 50% less time on visual inspections, 30–80% less on maintenance execution (Cognite's Aker BP page).
Read the story →Celanese (chemicals, global)
Built an integrated manufacturing portal ("Digital Plants of the Future") as a single repository for its domain experts. Cognite's Atlas AI page credits Celanese's Enhanced Troubleshooting Agent with a 50% acceleration of digital-transformation initiatives. Domain experts use no-code analytics on the same data foundation.
Read the story →Power generation & grid
Cognite lists power generation, grid and renewables as core industries: heat-rate and efficiency monitoring, outage planning, asset performance management (APM) across thermal, hydro, wind and solar fleets.
More customer stories →6.3 CDF versus what you already have
| Historian (PI / AVEVA) | Data lake / warehouse (Databricks, Snowflake, Fabric) | Cognite Data Fusion | |
|---|---|---|---|
| Strength | Fast, reliable time-series storage & trending | Cheap storage, powerful SQL/ML, IT-standard | Industrial knowledge graph + AI contextualization + ready-made industrial apps |
| Handles documents, P&IDs, 3D? | No | Stores them as blobs; no understanding | Yes — parses drawings, links 3D, annotates |
| Knows that tag X belongs to pump Y and drawing Z? | Only if someone typed it into AF | Only if you build and maintain the joins | Yes — discovered by AI, approved by experts, stored as graph edges |
| Apps for operators, maintenance, field? | Vision / PI Vision only | Build your own | Canvas, Charts, InField, Maintain, InRobot included |
| AI agents on plant data | No | DIY with LLM tooling | Atlas AI built in, with citations to the graph |
| Best role | The OT source that feeds CDF | Coexists: CDF can read from / write to it (e.g. Fabric connector) | The contextualised operations layer on top of both |
CDF does not replace the historian or the data lake. It sits on top of them and adds the relationships and the industrial apps. This is why your PI / OPC knowledge stays valuable — it becomes the foundation.
6.4 Should I invest in this skill? An honest view
✅ Reasons yes
- Industrial AI is where budgets are moving, and every industrial AI project needs exactly the contextualised data foundation CDF provides. The skill of building that foundation is scarce.
- Your background is the ideal entry point. Power-plant process knowledge + historian/OPC experience + CDF = a rare combination consultancies and owners pay for.
- Transferable concepts. Knowledge graphs, data modeling, DataOps, entity matching, Python SDKs, GraphQL — 80% of what you learn applies to any industrial data platform (AVEVA CONNECT, AWS IoT SiteWise, Azure Digital Twins, Fabric).
- Free, certifiable learning path. Cognite Academy certificates are free and recognised by Cognite's partner ecosystem.
- Partner ecosystem. Cognite sells through Microsoft, AWS, Google, Accenture, SLB and regional partners — that is where consulting demand comes from.
⚠️ Things to keep in mind
- It is a proprietary SaaS. Licences are enterprise-priced; small plants may not buy it. Your CDF-specific skills apply only where CDF is deployed.
- Customer base is concentrated in energy, chemicals and heavy manufacturing, historically strongest in Europe, the US, Japan and the Middle East. Check demand in your target market.
- The platform moves fast. Data modeling replaced the older "asset hierarchy" APIs; Atlas AI is new. Expect to keep learning.
- Ownership is changing. Schneider Electric's $3.1B acquisition (announced June 2026, closing pending approvals) will fold CDF and Atlas AI into AVEVA's CONNECT platform. Expect product names, packaging and roadmap to shift during integration — the concepts (knowledge graph, contextualisation, DataOps) will not.
- Depth needs Python. Levels 1–2 are largely no-code, but delivering real solutions (Level 3) means Python, SQL, YAML and Git.
Yes — with a plan. Finish Level 1 and the free CDF Fundamentals certificate (≈6 h) this month. That alone lets you talk credibly to clients about industrial data foundations. Then decide, based on client conversations, whether to go deep (Levels 2–3, the 4-day Practitioner bootcamp) or to stay at "solution architect who understands CDF" level. Either way the concepts are reusable — and if the Schneider/AVEVA deal completes, CDF becomes the data-and-AI layer of the same AVEVA family as the PI historian you already know, which makes the combination of PI + CDF skills more valuable, not less.
Where CDF runs — cloud, security & deployment
⏱ 45 min- How CDF is built and hosted
- What sits on premises versus in the cloud
- How users and machines are authenticated and authorised
7.1 Under the hood
- SaaS, multi-cloud. Cognite operates CDF on Microsoft Azure, Google Cloud and AWS. Your company's project is created in a regional cluster (e.g.
westeurope-1,az-eastus-1) — you choose the cloud and the region for data residency. - Micro-services on Kubernetes. Per a Cognite Hub answer by Jason Dressel of Cognite (July 2023), CDF is "300+ micro-services which are continuously deployed as many as 1000 times per week across development, staging and production environments". You never see this — you just get new features.
- Polyglot storage. Each data type uses the right engine: time series use a combination of FoundationDB, Kafka, PostgreSQL and Elasticsearch; files use cloud object storage; the graph has its own store. Again invisible to you, but it explains why CDF can hold billions of datapoints and still answer searches in milliseconds.
- You own the data. Cognite's terms state the customer retains ownership; Cognite processes it to provide the service.
7.2 What runs where
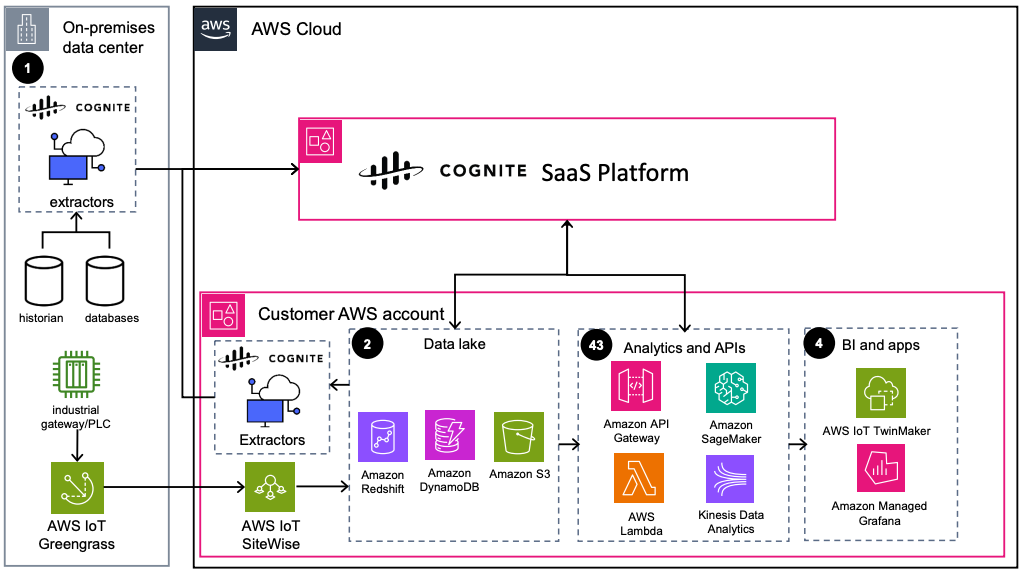
7.3 Security: who may do what
- No separate CDF passwords. CDF trusts your company's identity provider (OpenID Connect). Turning off someone's corporate account turns off their CDF access.
- Capabilities are fine-grained (per resource type × per action) and scoped (to a data set, a space, or specific IDs). "Read time series in the Unit 2 data set" is a normal rule.
- Extractors and scripts use client credentials (service principals), not personal logins.
- Certifications and continuity details are published on Cognite's trust portal (ISO 27001 appears on the architecture diagram).
Your identity provider is the HR system that issues your badge. CDF is the building: the badge reader (OpenID Connect) checks the badge is real, then the door list (groups & capabilities) decides which floors and rooms (data sets, spaces) it opens. Contractors' robots (extractors) get their own badges with just the doors they need.
7.4 Watch: CDF on the clouds
In your CDF login, open Admin → Access management (you may only have read access). Find the group you belong to and read its capabilities. Identify one data-set-scoped capability and one project-wide one.
Checkpoint quiz & your next steps
⏱ 60 min8.1 Ten-question self-check
1. Which three families of plant data does CDF unify?
2. "Contextualization" in CDF means…
3. What is RAW?
4. A transformation in CDF typically…
5. In the Core Data Model, CogniteAsset vs. CogniteEquipment is like SAP's…
6. Which is NOT one of the four data-modeling building blocks?
7. Which tool is the collaborative whiteboard with P&IDs, charts, 3D and comments?
8. Which of these runs on premises in a typical CDF deployment?
9. How do users authenticate to CDF?
10. CDF's relationship to an existing PI historian is best described as…
8.2 Earn the official certificate
Now take the free official path — it repeats what you learned here with Cognite's own slides and a hands-on part, and ends with a badge and a certificate for LinkedIn. (The full recommended order for the whole Academy portal is on the course home page.)
8.3 Recommended reading & watching before Level 2
- docs.cognite.com/cdf — read the "About CDF" page and skim the left menu so you know where things are.
- "Cognite Data Fusion Explained: Solving the Industrial Data Problem" (Medium) — a good independent summary.
- The Definitive Guide to Industrial DataOps (free e-book, registration).
- Full video library, grouped by level: Resources → Videos.
A preview of where this is going
Level 2 makes you productive: you will configure an extractor, write a transformation, build a small data model, run entity matching on real tags, and pull data with the Python SDK. Level 3 makes you a solution builder: Toolkit-based CDF-as-code, custom extractors, orchestration, and building Atlas AI agents.
Glossary
timeseries:READ) with a scope.